Tips On Creating The Perfect Flow Chart
Deprecated: preg_split(): Passing null to parameter #3 ($limit) of type int is deprecated in /home/dailwtkh/public_html/wp-content/themes/jannah/framework/functions/post-functions.php on line 863

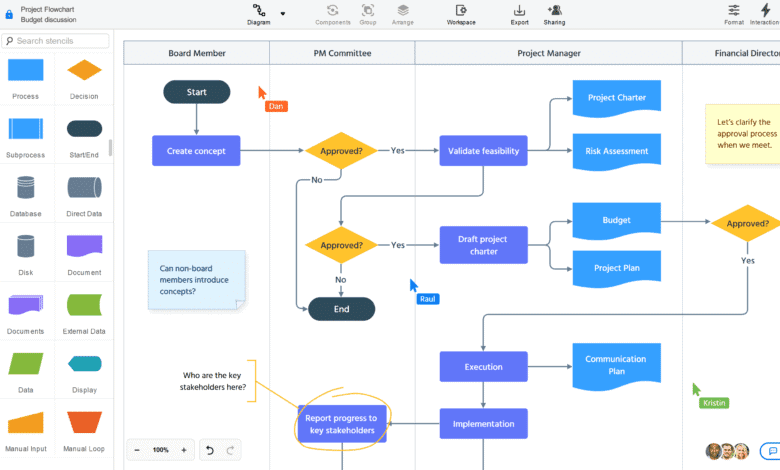
The use of flowcharts in the office spaces is a trend that is hard to outlive considering the benefits. Despite the traditional manual flowcharts being popular, new technology is taking the spotlight in the modern office. Computer software is now useful in creating flowcharts as long as you provide the process, the possible outcomes and the decisions for either outcome in a stage. However, the design and structure of both types of flowcharts remain similar and require the same strategies to create. The following are tips to help you come up with a good flowchart to help achieve a business process:
Be consistent with your designs
First, develop a consistent design for your layout. Ensure that all the shapes you sure are of the same size and are equally spaced. One of the things that makes a flowchart look out of place are shapes that are not the same size. It would help if you created a pattern that works and looks good. Uniformity is the easiest way to make your flowchart look good and easy to understand.
Use one page
Another thing that will make your flowchart easy to understand is keeping everything on one page. People want to follow through with whatever you are lecturing for future applications in a flowchart. If content spills over to a new page, then chances are their train of thought will be cut short. If you realize that you have so much to say, summarise it. That way, whatever you put in your shapes and design can be understood. If you need to explain it further, you can do so in a presentation. Do not try to fit everything you tried to say in one flowchart. Summarise it, so everyone knows what you teach.
Let data flow in one direction
So many people do not understand your data because they have no idea how it flows. For the better part, people read from left to right. Having your data flowing in that way will make it easy to read and understand. If you have data that is flowing and it flows from one line to another, you might have to think outside the box. When line one flows from left to right, line two will flow from right to left. The aim here is to ensure that if a line exists, it should be a straight line from the first shape to the last one.
Use return lines where necessary
Even though data will be flowing on a linear path, you can still use return lines where necessary. All you have to do is draw return lines to follow what is going on. Return lines will come in handy, so you do not have to repeat content in your flowchart.
Creating a good flowchart is not as hard as people see it. Figure out what you want to display and how to summarise it. Once you do that, all left is to present it so that everyone understands. The graphics make the flowchart self-explanatory, with details easy to decipher.
For more valuable information visit this website


